For practical use of titanium, it is important to make clear its fatigue character. The fatigue crack growth rate (da/dN) in crystalline metals is in the range of 10-6 to 10-3 mm, and this crack extension is usually smaller than the grain size of such materials. Therefore, it is extremely important to know the fatigue crack growth mechanisms that may occur in a grain to promote increased understanding of the intrinsic fatigue crack growth resistance of materials. Moreover, in case of titanium, many types of deformation mode such as slip and twin exist because of its hcp structure. Then, it will be easy to expect that titanium have strong orientation dependence for fatigue behavior. In this study, to clarify the orientation dependence of fatigue behavior in titanium with various orientations, fatigue test of five types single crystals was done by originally developed method.
Figure 1 shows dimension of single crystal specimen. Single crystals were made from pure titanium ingot. Grains of the ingot were increased about 20 mm by annealing at 1123K, and single crystal specimens with size of 3 mm in width, 20 mm in length and 0.3 mm in thickness were cut from the coarse grains. A hole of 0.5 mm in diameter was introduced to the specimen, which is act as a notch for crack initiation. Bending stress amplitude ![]() a at notch part was estimated from displacement of free end of the specimen and equation of bending stress of single cantilever. Fatigue test was carried with stress ratio R = -1 and frequency range of 200 to 300 Hz at room temperature in laboratory air.
a at notch part was estimated from displacement of free end of the specimen and equation of bending stress of single cantilever. Fatigue test was carried with stress ratio R = -1 and frequency range of 200 to 300 Hz at room temperature in laboratory air.
Figure 2 shows orientations of the specimens. Five types of specimen with different orientation were prepared considering crystallographic symmetry of hcp structure.
Figure 3 shows the relation between ![]() a and cycles to failure Nf (S-N plots) of all specimens. The fatigue limit was observed at 3x10⁷
a and cycles to failure Nf (S-N plots) of all specimens. The fatigue limit was observed at 3x10⁷![]() 108 cycles in each specimen. Fatigue limit of E- and F-specimen was about 550 and 500 MPa, respectively. On the other hand, fatigue limit of D-specimen was about 290MPa and was nearly half of F-specimen. Fatigue limit of A- and B-specimen was about 350 MPa. Namely, these plots are almost divided in three groups.
108 cycles in each specimen. Fatigue limit of E- and F-specimen was about 550 and 500 MPa, respectively. On the other hand, fatigue limit of D-specimen was about 290MPa and was nearly half of F-specimen. Fatigue limit of A- and B-specimen was about 350 MPa. Namely, these plots are almost divided in three groups.
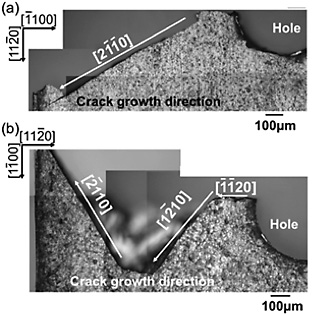
Figure 4 shows the fatigue crack profile of the A and B-specimens. The crack growth directions in the A-specimen are [2110] which deviates 30![]() from the mode I crack growth direction [1100] in A-specimen. The crack in the B-specimen extend zigzag route along [1120], [1210] and [2110]. The crack in both specimens was extended along
from the mode I crack growth direction [1100] in A-specimen. The crack in the B-specimen extend zigzag route along [1120], [1210] and [2110]. The crack in both specimens was extended along ![]() 1120
1120![]() independent to loading direction.
independent to loading direction.
Figure 5 shows typical fatigue surface of B-specimen. The striation-like markings parallel to [0001], which is perpendicular to the crack growth directions, were observed on the fatigue surface. Similar striation-like markings were also observed in the fatigue surface of A-specimen.
Figure 6 shows the orientation relationships between the fatigue crack plane and the possible prismatic slip systems in A- and B-specimens. The crack plane is a bisector of the two prismatic slip planes. Therefore, a crack will grow parallel to ![]() 1120
1120![]() , by alternating shear of these two prismatic slips at crack tip, and then, striation-like markings aligned along the [0001], should be formed on the fatigue surface. We conclude that same fatigue mechanism is activated in A- and B-specimens. Therefore, S-N plots are almost same for both specimens.
, by alternating shear of these two prismatic slips at crack tip, and then, striation-like markings aligned along the [0001], should be formed on the fatigue surface. We conclude that same fatigue mechanism is activated in A- and B-specimens. Therefore, S-N plots are almost same for both specimens.
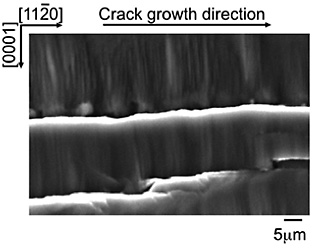
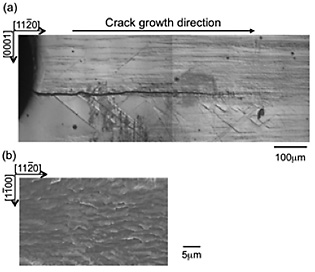
Figure 7 shows the typical crack profile and fatigue fracture surface of D-specimen. The fatigue crack propagated parallel to [0001] with many slip trace parallel to the crack. On the fracture surface, coarse grooves parallel to [0001], which is crack growth direction of this specimen, was observed.
Figure 8 shows microstructure just under the crack surface by using TEM. However, there were many {1012} twins below the crack, the crack mainly propagated in matrix region and area fraction of twin on fracture surface seem to be small as shown in the figure. In the matrix region, many a-screw dislocations were also observed.
Figure 9 shows crack propagation mechanism of D-specimen. A crack in D-specimen would propagate along to [0001] with a {1010} prismatic slip.
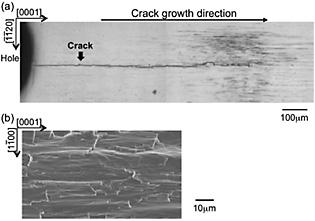
Figure 10 shows the typical crack profile and fatigue fracture surface in F-specimen. The crack propagated parallel to (0001) basal plane with many slip traces, which is parallel to [1120]. Small amount of {1012} twin traces were also formed from the crack. On the fatigue surface, coarse markings parallel to [1120] were observed. At lower ![]() a around fatigue limit, the crack also propagated parallel to basal plane as same as at higher stress. However, slip traces were scarcely formed.
a around fatigue limit, the crack also propagated parallel to basal plane as same as at higher stress. However, slip traces were scarcely formed.
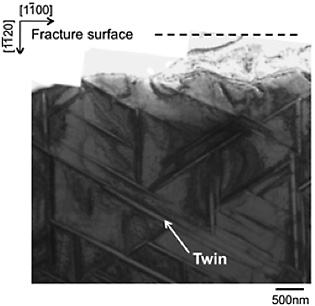
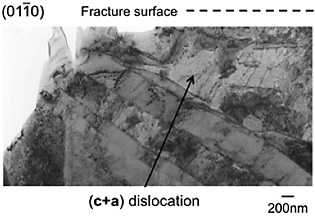
Figure 11 shows TEM observation of F-specimen. {1012} twin was observed below the crack surface. In the matrix region, many (c+a) and c dislocations inclined about 60 degrees to basal plane were observed. These results indicate that {1011}![]() 1123
1123![]() first order pyramidal slip would be activated at the crack tip in F-specimen.
first order pyramidal slip would be activated at the crack tip in F-specimen.
Figure 12 shows estimated crack mechanism of F-specimen. CRSS of the pyramidal slip in titanium is not clear yet, but it will be very high at room temperature. Therefore, stress required to grow fatigue crack along basal plane would be high.
Crack orientation dependence of fatigue behavior in pure titanium was investigated by using five types of single crystal specimens. As a result, S-N plots of each specimen showed strong orientation dependence. From slip trace analysis and TEM observation, three different crack mechanisms were proposed.