Development of Intense Plastic Strain and Ultrafine Grains in Thicker Samples
Processed by High-Pressure Torsion and High-Pressure Sliding
Hideaki Iwaoka, Tadayoshi Fujioka, Yosuke Harai and Zenji Horita
Department of Materials Science and Engineering, Faculty of Engineering, Kyushu University,
Fukuoka 819-0395, Japan
Intense plastic strain is imparted into disk-and ring-shape samples using high-pressure torsion (HPT) which is known as a typical process of severe plastic deformation as illustrated in Fig. 1 (a). The grain size is refined to the submicrometer and/or nanometer range. The grain refinement is also achieved using high-pressure sliding (HPS) which was developed recently for rectangular sheet samples under high pressure as in Fig. 1(b). However, the samples with the thickness thinner than 1 mm are usually used for both HPT and HPS processes but no attempt has been made for samples with the thickness thicker than 1 mm. This study is then initiated to investigate how homogeneously the strain is developed and the grain refinement is achieved in the thicker samples. High purity Al (99.99%) is used with ring-shape and rectangular sheet samples having thicknesses of 2 and 4 mm. The former results with HPT are shown in Fig. 2 (a) and (b) for the thicknesses of 2 and 4 mm, respectively, and the latter is in Fig. 3 for 2 mm. It is shown that a region of intense plastic strain develops at the center height and expands to both upper and lower edges with straining as summarized in Fig.4. The grain refinement is achieved at such an intense plastic region with dislocation-free grains with the sizes of a few micrometers as in Fig. 5.
[Published in J. Japan Inst. Metals, 75 (2011) pp 412-418.]
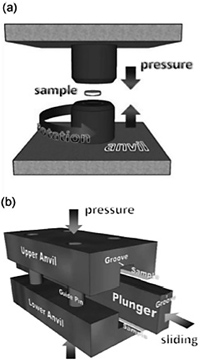 |
Fig.1 Schematic illustrations of (a) High Pressure Torsion (HPT) and
(b) High Pressure Sliding (HPS). |
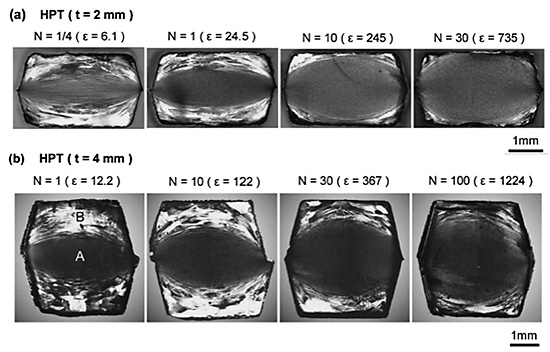 |
| Fig. 2 Cross-sections of (a) 2 mm HPT and (b) 4 mm HPT samples observed by OM. |
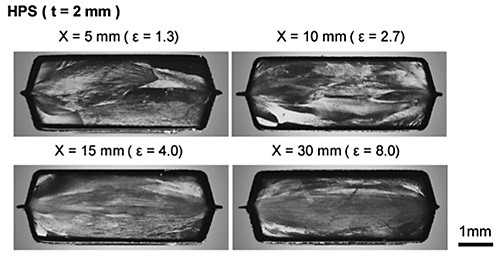 |
| Fig. 3 Cross-section of 2 mm HPS samples observed by OM. |
 |
| Fig. 4 Widths of recrystallized areas of HPT samples plotted
against equivalent strain. |
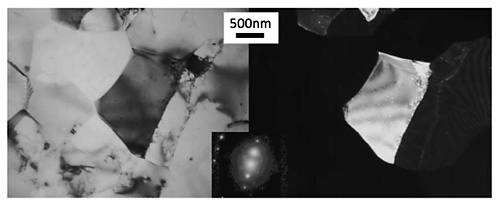 |
| Fig. 5 TEM bright-field images (left) and dark-field images (right) with SAED
patterns (inset) of center part of 4mm ring samples after N=1. |