Hypereutectic Al-Si alloy, which inherent shortages prevent the practical usage up to now, has superior properties and has been expected the utilization. With the view to overcome the shortages by the semi-solid forming processes, the rheological behavior of hypereutectic Al-25 mass% Si alloy has been studied using a self-made parallel-plate drop-forge viscometer illustrated in Fig. 1. It consists of electric furnace, bottom plate, top plate, laser sensor, magnetic chuck and computer, etc. The major parts of the instrument are contained in the electric furnace in order to compress a specimen in an isothermal condition. The top plate, which is suspended above the bottom plate in the furnace to press a specimen with the freely falling weight, is attached to a platen rod so as to adjust the falling distance. In contrast, the configuration of bottom plate is hollowed out like a container to prevent the damage of heater from the scatter of pressed material.
Cylindrical specimens of diameter Ro=20 mm ![]() height ho=15 mm are cut out by the electro- discharge machine from Al-25 mass% Si ingot which chemical composition is 24.7 mass% Si, 0.14 mass% Fe, 0.00 mass% Cu, balance Al. Referring to the Al-Si alloy binary phase diagram, the tested temperatures have been chosen to be in a range from 578 to 590
height ho=15 mm are cut out by the electro- discharge machine from Al-25 mass% Si ingot which chemical composition is 24.7 mass% Si, 0.14 mass% Fe, 0.00 mass% Cu, balance Al. Referring to the Al-Si alloy binary phase diagram, the tested temperatures have been chosen to be in a range from 578 to 590![]() . The standard mass of top plate is 7.6 kg and masses of 7.1 and 9.2 kg are also applied for comparison. The conditions and corresponding specimen numbers are summarized in Table 1. The falling distance of top plate is set at 30 cm and it makes possible to achieve the shear rate more than 104 s-1. The displacement of the top plate is monitored with a computer through a laser sensor for a period of 2 s at sampling time of 0.02 ms. The variation of viscosity and shear rate with respect to time are analyzed from the digital data. The effective duration of compression, i.e., the acting time of forging force on a specimen, depends on both the falling distance and the mass of top plate.
. The standard mass of top plate is 7.6 kg and masses of 7.1 and 9.2 kg are also applied for comparison. The conditions and corresponding specimen numbers are summarized in Table 1. The falling distance of top plate is set at 30 cm and it makes possible to achieve the shear rate more than 104 s-1. The displacement of the top plate is monitored with a computer through a laser sensor for a period of 2 s at sampling time of 0.02 ms. The variation of viscosity and shear rate with respect to time are analyzed from the digital data. The effective duration of compression, i.e., the acting time of forging force on a specimen, depends on both the falling distance and the mass of top plate.
The viscosity of the instantaneous volume averaged value, ![]() , is given by the following equation by applying the Stefan equation and referring to the exposition of Yurko and Flemings .
, is given by the following equation by applying the Stefan equation and referring to the exposition of Yurko and Flemings .
| (1) |
where mp is the mass of top plate, g is the gravity and h is the height of the specimen at time t. The first and second derivatives of dh/dt and d2h/dt2, respectively, are obtained directly from the relation between displacement and time data. The instantaneous volume averaged shear rate, ![]() , of cylindrical specimen is calculated using
, of cylindrical specimen is calculated using
| (2) |
where R is the outer radius of specimen at time t. Thus, both the viscosity and the shear rate are calculated as a function of time.
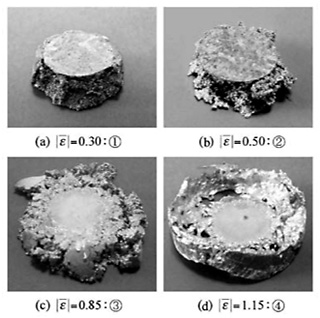
Typical profiles of cylindrical specimen after drop-forged are shown in Fig. 2. The equivalent strain, |![]() |, presented in Fig. 2 is evaluated by
|, presented in Fig. 2 is evaluated by
| | |
(3) |
where ha is the height, i.e., thickness, of the specimen after experiment. They indicate that the deformation is nearly uniform when the potential energy of the top plate is converted to a kinetic energy and is supplied to the specimen. It is observed that aluminum alloy melt seeped through solid material and then solidified like droplets. Moreover, the compressed specimens are scattered in all direction collided with the wall of the bottom plate at higher tested temperature. The result suggests that the specimens are compressed almost exactly homogeneous under the semi-solid condition.
The variations of the viscosity and the shear rate based on Eqs. (1) and (2), respectively, are represented in Fig. 3 with curves on a double logarithmic chart. In Fig. 3, open circle and allow on each curve indicate the point of minimum viscosity and the final stage of deformation, respectively. The minimum viscosity and the corresponding shear rate for each tested conditions are also listed in Table 1. In the early stage of deformation, viscosity decreases because the shear rates increase under the impact loading. While the viscosity turns to increase when the shear rates begin to decrease with the release of compression energy supplied by the freely falling top plate. This means that the viscosity increases according as the shear rate decreases and the minimum viscosity is achieved at around the maximum shear rate. An overall linear relationship on a log graph paper is established with broken line as shown in Fig. 3. The summarized behavior between the viscosity, ![]() [Pa
[Pa![]() s], and the shear rate,
s], and the shear rate, ![]() [s-1], can be described by a power-law model of
[s-1], can be described by a power-law model of
| (4) |
The decrease in the viscosity accompanied with the increase in the shear rate depends on both increa ses in the tested temperature and the applied force, not the duration of forging. This shows the fact that forging under higher temperature and faster shear rate is favorable in order to overcome the deformation resistance against the flow of material.
Figure 4 shows the variation of duration of deformation as a function of viscosity. The filled circles indicate measured values and the convex shape solid curve is the approximate one. The measured effective duration initially increases and then decreases with a reduction in viscosity. The curve shows that the effective duration reaches a maximum at around ![]() =30 kPa
=30 kPa![]() s where
s where ![]() =70 s-1 which is calculated from Eq. (4). The cause for a convex curve profile is qualitatively explained as follows. In a range exceeded
=70 s-1 which is calculated from Eq. (4). The cause for a convex curve profile is qualitatively explained as follows. In a range exceeded ![]() =30 kPa
=30 kPa![]() s, the top plate bounces to the specimen providing a little compressive deformation because of poor deformability and the experiment comes to an end in a relatively short duration. Then a reduction in viscosity accompanied with moderate softening and melting of the alloy arises a relatively long duration. Lastly, the lowering of viscosity in less than
s, the top plate bounces to the specimen providing a little compressive deformation because of poor deformability and the experiment comes to an end in a relatively short duration. Then a reduction in viscosity accompanied with moderate softening and melting of the alloy arises a relatively long duration. Lastly, the lowering of viscosity in less than ![]() =30 kPa
=30 kPa![]() s provides easiness of compression and brings in a short duration of forging again.
s provides easiness of compression and brings in a short duration of forging again.
Open squares in Fig. 4, which fitted curve is shown by single dotted line, indicate the calculated duration that comes from idle and effective durations. Both durations are calculated by dividing the corresponding reduction in specimen height, ![]() h, by velocity. The idle duration arises exclusively from the softening below
h, by velocity. The idle duration arises exclusively from the softening below ![]() =30 kPa
=30 kPa![]() s and is the period where detectable deceleration is not observed under freely fall of the top plate. The velocity at the time of contact with ho=15 mm specimen is estimated around vmax=2.4 m/s
s and is the period where detectable deceleration is not observed under freely fall of the top plate. The velocity at the time of contact with ho=15 mm specimen is estimated around vmax=2.4 m/s![]() in the present condition. On the other hand, the calculated effective duration shown by open circles and approximated by a broken line is the period where the specimen is compressed at a velocity of vav =1.2 m/s that is the average value of top velocity of 2.4 m/s and zero velocity under constant deceleration. Calculated effective duration is consistent with the measured one. Thus, the viscosity
in the present condition. On the other hand, the calculated effective duration shown by open circles and approximated by a broken line is the period where the specimen is compressed at a velocity of vav =1.2 m/s that is the average value of top velocity of 2.4 m/s and zero velocity under constant deceleration. Calculated effective duration is consistent with the measured one. Thus, the viscosity ![]() =30 kPa
=30 kPa![]() s, which seems to be the transition point of the flow process dominant factor from plastic forming to casting and vice versa, is inferred to be the optimum condition for semi-solid and /or semi-melt forming.
s, which seems to be the transition point of the flow process dominant factor from plastic forming to casting and vice versa, is inferred to be the optimum condition for semi-solid and /or semi-melt forming.