The principles of semi-solid forming as a metal forming process fall between those of plastic forming (forging) and casting. The rheological behavior of semi-solid metal at high shear rates is the most important factor for characterizing metal flow during manufacturing processes and the behavior of the Al-25 mass% Si alloy was investigated to determine the potential for the practical processing of hypereutectic Al-Si alloys using semi-solid forming. To evaluate the dynamic viscosity, a parallel-plate drop-forge viscometer was constructed and the effects of the test temperature and applied force on the viscosity were examined.
The displacement of the cylindrical specimen with a radius Ro = 10 mm and a height ho = 15 mm was measured to analyze both the viscosity and shear rate as a function of the duration of deformation. The test temperatures were selected to fall in the range from 851 K (578 °C) to 863 K (590 °C) and were between the solidus and liquidus temperatures. The falling distance of the top plate was set at H = 30 cm and the standard mass of the top plate during free fall was 7.6 kg.
In a parallel-plate drop-forge viscometer, the viscosity, µ, is given as
| (1) |
where mp is the mass of top plate, g is the gravity and h is the height of the specimen at time t. The shear rate,![]() , of cylindrical specimen under compression is given by
, of cylindrical specimen under compression is given by
| (2) |
where R is the outer radius of the specimen at time t.
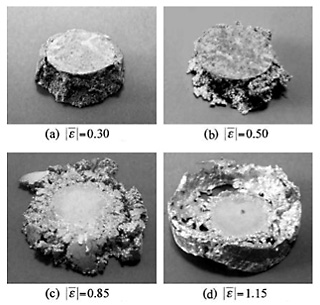
The potential energy of the top plate was converted to a kinetic energy and is supplied to each specimen in the parallel-plate drop-forge viscometer. Figures 1 show the typical profiles of deformed specimens obtained at temperature ranging from 851 K (578 °C) to 863 K (590 °C) under an applied mass of 7.6 kg. The specimens were nearly homogeneously compressed under the semi-solid conditions because seeped alloy droplets were observed in all directions on the side surfaces of the cylindrical specimens. An increase in both the test temperature and applied force led to a loss of the ability to resist deformation.
The variations in the viscosity and shear rate as a function of time, i.e., the duration of deformation, were analyzed using the digital data for the effective compressive displacement. The relationships between the viscosities and shear rates for each of the different specimens are summarized in Fig. 2. In individual experiments, the viscosity was observed to initially decreased as the shear rate increased and subsequently increased as the shear rate decreased. These results depended on both the test temperature and the applied force but were independent of the duration of deformation. In addition, the measured viscosities and shear rates for the specimens used in the present study ranged from hundreds to several tens of thousands of Pa·s and dozens to several thousands of s-1, respectively. An overall linear relationship on a log scale was established as indicated in Fig. 2 with the broken line. The summarized relationship between the viscosity (µ [Pa·s]) and the shear rate ( ![]() [s-1]) can be described using the power-law model as follows:
[s-1]) can be described using the power-law model as follows:
| µ = 1.78 |
(3) |
Equation (3) shows that the decrease in viscosity is accompanied by an increase in the shear rate.
Figure 3 shows the variation in the duration of deformation as a function of the viscosity. The representative viscosity for each specimen was selected as the individual minimum viscosity shown in Fig. 2. The filled circles indicate the measured effective durations of deformation, and the convex solid curve represents the approximate one. The effective duration of deformation was defined as the time that elapsed from the beginning of the detectable deceleration of the top plate to the point when the velocity of the top plate became zero. Figure 3 shows that the measured effective duration of deformation initially increased and then decreased with a reduction in the viscosity and reached a maximum at approximately µ = 30 kPa·s.
The phenomena leading to the convex shape of the curve shown in Fig. 3 can be quantitatively discussed by considering the deceleration of the top plate. The relationship between the falling velocity of the top plate and the compression stroke is assumed to conform to a linear function with constant deceleration and/or no acceleration and thus can be expressed as an idealized straight line as shown in Fig. 4. In the present study, the effective duration of deformation increased and then decreased with the transition point occurring at µ = 30 kPa·s. The experimental results for the different specimens were thus divided into two groups: less than and greater than µ = 30 kPa·s. Here, the velocity of the top plate at the time of contact with a specimen was simply estimated as vmax = ![]() = 2.4 (m/s) under the present conditions. The dotted line DF in Fig. 3 indicates the duration required for a 15 mm fall with a velocity of 2.4 m/s, which is approximately 6.2 ms, and is the maximum duration for the full compression of a specimen. When µ > 30 kPa·s, the changes in velocity for specimens (a), (b), and (e) were considered to follow the lines OA, OB, OE in Fig. 4, respectively, and the velocity varied from vmax to zero in a short period. In this case, the reduction in specimen height, Δh (= ho-ha, where ha is the height after the experiment) and the average velocity, vav, was equivalent so that the effective duration of deformation, t (= Δh/vav), was proportional to the amount of compression stroke.
= 2.4 (m/s) under the present conditions. The dotted line DF in Fig. 3 indicates the duration required for a 15 mm fall with a velocity of 2.4 m/s, which is approximately 6.2 ms, and is the maximum duration for the full compression of a specimen. When µ > 30 kPa·s, the changes in velocity for specimens (a), (b), and (e) were considered to follow the lines OA, OB, OE in Fig. 4, respectively, and the velocity varied from vmax to zero in a short period. In this case, the reduction in specimen height, Δh (= ho-ha, where ha is the height after the experiment) and the average velocity, vav, was equivalent so that the effective duration of deformation, t (= Δh/vav), was proportional to the amount of compression stroke.
The results for remaining specimens (c), (d), (f), and (g) with viscosities less than 30 kPa·s did not go along with the dotted line of BED in Fig. 3. Then experimental duration of deformation, i.e., overall duration of deformation, was considered to be composed of a combination of the idle and effective durations of deformation. The idle duration was the period where detectable deceleration was not observed under the free fall of the top plate during compression stroke from ho to hs, where hs is the specimen height at the beginning of a detective deceleration of the top plate. It must be arisen exclusively in the viscosity range of µ < 30 kPa·s. From this assumption, the velocities of top plate in case of specimens (c), (d), (f), and (g) changed along the path of Oc-cC, Od-dD, Of-fF, Og-gG in Fig. 4, respectively. Overall durations were shown by open squares and its fitted line was single dotted one in Fig. 3. The effective duration of deformation decreased with decrease of viscosity because of increase of the idle duration. Calculated effective durations shown by open circles were consistent with the measured one as shown in Fig. 3.
Thus, the origin of this profile can be attributed to a combination of both a moderate working time and an adequate deformation, which resulted from a decrease in the deformation resistance accompanied by a lowering of the viscosity. The viscosity at the maximum effective duration of deformation thus corresponds to the transition point for the change in the flow process dominant factor from plastic forming (forging) to casting. Therefore the viscosity µ = 30 kPa·s, which corresponds to the transition point for the change in the flow process dominant factor from plastic forming to casting and vice versa, is believed to be the optimum viscosity for the semi-solid forming of the Al-25 mass% Si alloy. The approximate temperature condition can be ranged from 855 K (582 °C) to 859 K (586 °C).