Metallurgical Abstracts on Light Metals and Alloys vol.54
Dislocation motion in Al–Mg alloys in the creep region characterized by activation volume
Hidenari Takagi
Department of Materials Processing, Tohoku University
[Published in Materials Transactions, Vol. 62 (2021), No. 9, in press]
https://doi.org/10.2320/matertrans.MT-M2020359
E-mail: takagi.hidenari[at]nihon-u.ac.jp
Key Words:thermal activation process, dislocation, effective stress, indentation
In this study, the effective stress and activation volume during creep in Al–Mg solid-solution alloys were determined using indentation techniques. The obtained effective stress and activation volume corresponded to the results obtained from the uniaxial test. At the tested creep rate of ε1 = 1 × 10⁻⁵ -4 × 10⁻³ s-1, the obtained activation volume decreased with increasing solute concentration, a trend opposite to that of the effective stress. Using this activation volume and previously reported computer simulation results of the interactions between dislocations and solute atoms, the thermal activation process of dislocation motion during creep in several Al–Mg solid-solution alloys was investigated. The thermally activated dislocation length decreased with increasing stress and was smaller than that between the forest dislocations. The results indicated that dislocations during creep could overcome thermal obstacles when the corresponding effective stress was interpolated against the increase/decrease in thermally activated dislocation length, and each dislocation fragment on the length between forest dislocations moved individually through each thermal activation process.
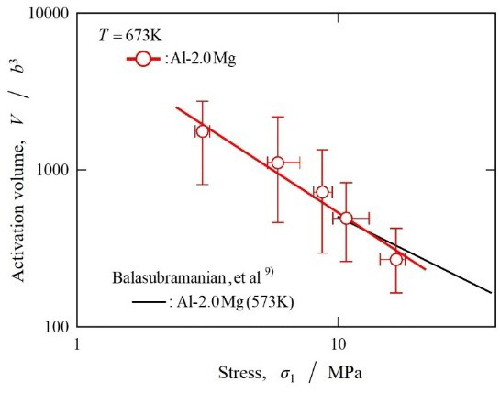
Figure 1 shows the stress dependence of the activation volume V for Al–2.0Mg. The obtained values were V = 2300b3 - 270b3 in σ1 = 3.0 - 16.6Mpa, where b = 2.86 × 10⁻¹⁰m. The black line in the figure indicates the results of the uniaxial test; the obtained results correspond well with the absolute values and stress dependence from the literature.
The activation volume is defined as the swept area lw when a dislocation length of l overcomes the thermal obstacle and moves by distance w. To estimate a reasonable combination of l and w, the computer simulation results for the interaction between dislocations and solute atoms in solid-solution alloys of Leyson et al. were used. Numerical calculations were performed based on the dislocation motion model proposed by Labusch, with the assumption that moving dislocations interact simultaneously with several solute atoms. The results show that for the thermally activated dislocation length l and distance w, values of lc and wc exist for which the total dislocation energy is minimized. Moreover, l and w increase with increasing temperature. The relationship among l, w, lc and wc is then l/lc = (w/wc)φ, where Φ = 1.47. Through molecular dynamics simulations using EAM potentials in the context of the Labusch model, Olmsted et al. obtained two possible cases of lc and wc, namely, lc ≅ 32 × 10-10m and wc ≅ 10 × 10-10 at absolute zero (case 1) and lc ≅ 52 × 10-10 m and wc ≅ 20 × 10-10 m at 300 K (case 2), respectively, for edge dislocations in Al–5mol%Mg. By substituting these values of lc, wc, and Φ into above equation, the following relationships are obtained:

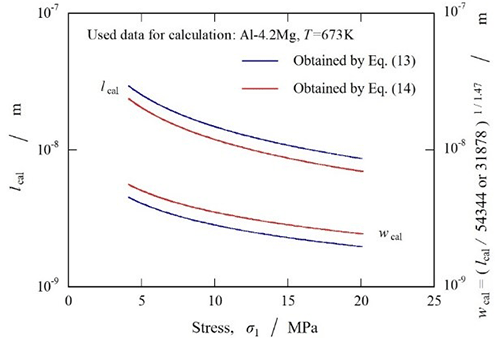
The combination of lcal(=l) and wcal(=w) in the above two equations is determined when these two equations hold. The calculated activation volume Vcal(=lcalwcalb) is associated with the activation volume of Al–4.2Mg determined in this study. Figure 2 shows the stress dependences of lcal and wcal obtained from the activation volume in Al–4.2Mg and from the above equations. The lcalwcal value was 150–1500 times greater than b2 (b = 2.86 × 10⁻¹⁰ m). In other words, about 6–60 solute atoms were present in the swept area, which implies that the moving dislocations interacted simultaneously with several solute atoms. Therefore, the lcal and wcal obtained via the above-mentioned process, as shown in Fig. 2, can then be considered the thermally activated dislocation length and distance during creep, respectively.

Fig. 1 Stress dependence of the activation volume V for Al–2.0Mg. The black line indicates the uniaxial test results.

Fig. 2 Stress dependence of lcal and wcal, which were determined using experimental data of the activation volume obtained in this study and computer simulation results reported elsewhere.
